AI Data Mapper: automating the Most Painful Step in Data Integration
Overview
In the Make, Move, and Sell industry, the data behind each shipment has exploded. For every million parts that move through the supply chain, billions of data points follow.
Historically, Epicor’s data consultants spent massive amounts of time cleaning, mapping, and shaping this data for small customers integrating with Epicor’s large Enterprise Resource Planning (ERP) softwares. Before consultants could transform any data, they spent weeks figuring out where the data should go and how it should behave.
Why it matters: Even after signing, customers working with consultants often waited months before their data flowed into the Epicor’s ERP.
Opportunity: Automate the most manual, time-intensive step: data mapping.
Design Goals:
Make mapping workflows faster and more intuitive.
Reduce manual effort through clear, trustworthy AI suggestions.
Provide a consistent, predictable mapping experience across the platform.
Increase user confidence by surfacing accuracy and rationale in the UI.
Support quicker onboarding with a streamlined, guided mapping flow.
Why This Project Was Unique
This was the first AI-driven feature in the Grow Data Platform.
It was exciting because users want automation everywhere.
It was challenging because I did not want to add AI just for the sake of it.
Team structure also added complexity:
The Data Platform had its own product and development team
AI discovery was driven separately by product and data science
It felt like building a car with one team while the computer engineer worked on an island across the street.
Tight collaboration was essential, and early hesitancy put the project timeline at risk.
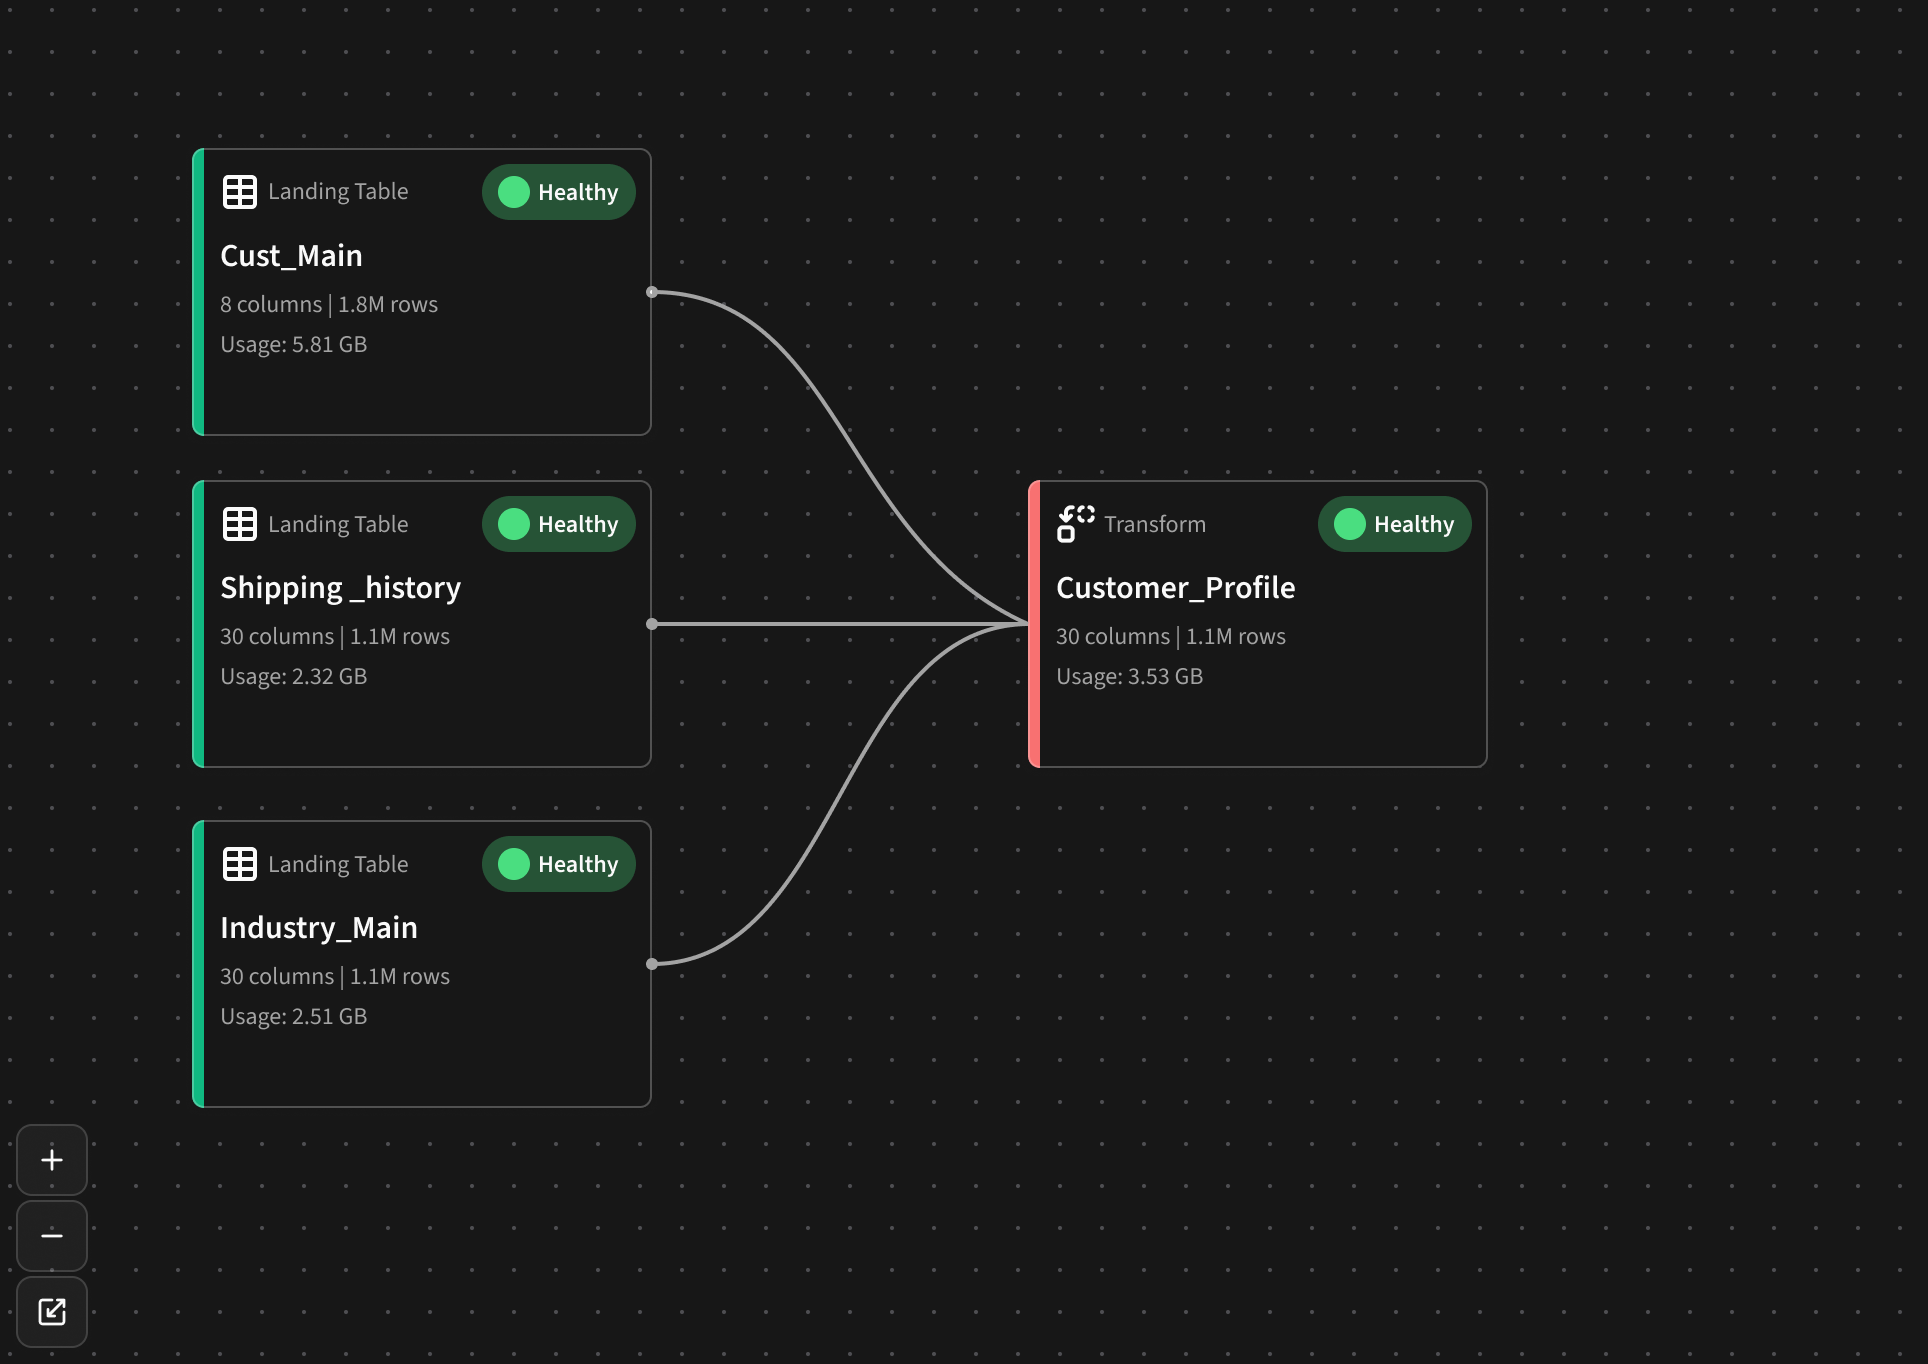
Data Platform pipeline canvas — where AI mapping connects.
Can’t We Just Automate Everything?
If we know Point A (the source data) and Point B (the target schema), shouldn’t it all be automatic?
I wondered the same thing.
But after spending a week onsite with our data experts observing their workflow, pain points, and their dream tool, it became clear: their work is both science and art.
We cannot fully replicate their process.
We can automate the slowest parts.

What the Consultants Actually Do
Configure environments
Map legacy data to Epicor schemas
Validate correctness
Coordinate import into ERP systems
Use the Grow product to create pipelines, apply business logic, and collaborate with customers
They need: efficiency, repeatability, and confidence.
Their core ask:
“As a Data Integration Consultant, I want to validate mapping suggestions line-by-line so I can trust AI recommendations.”

Designing the First-Pass Flow
For the initial release, I focused on a realistic and technically feasible flow:
1. Data is already loaded into the platform.
An automated trigger fires the AI Mapper and suggested mappings are ready for consultant to review.
2. Because of existing constraints, mappings must attach to a single pipeline.
The pipeline list shows:
Pipeline status
AI Mapping status (This helps consultant know what to review first.)
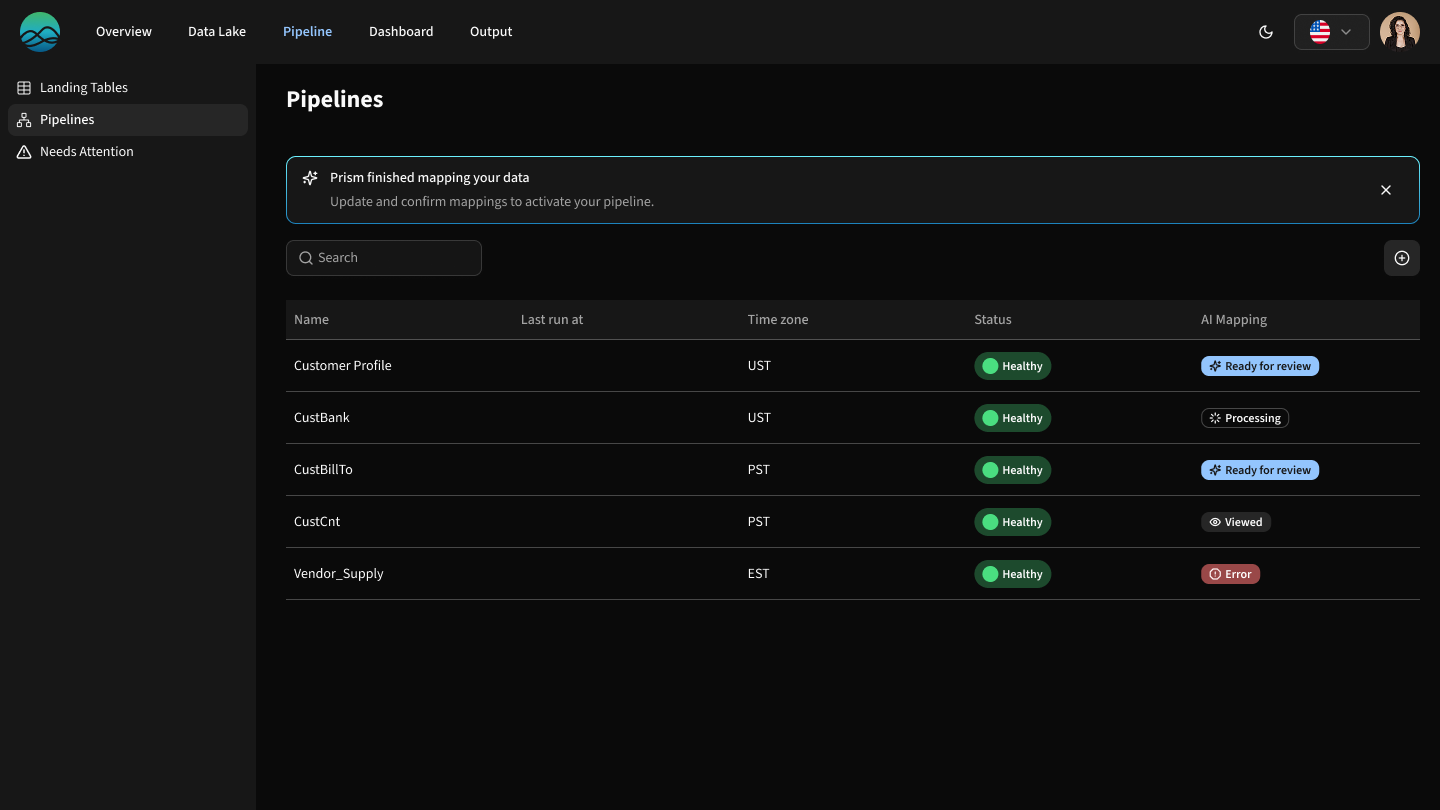
Data experts map pipelines, some with AI-suggested reviews.
Choosing the Mapping UI
I tested two patterns:
A visual canvas with mapping lines
A table-based layout with dropdowns
Users preferred the visual mapping lines, even though both options need deeper usability testing.
Given time and resourcing constraints, we moved forward with the visual approach.
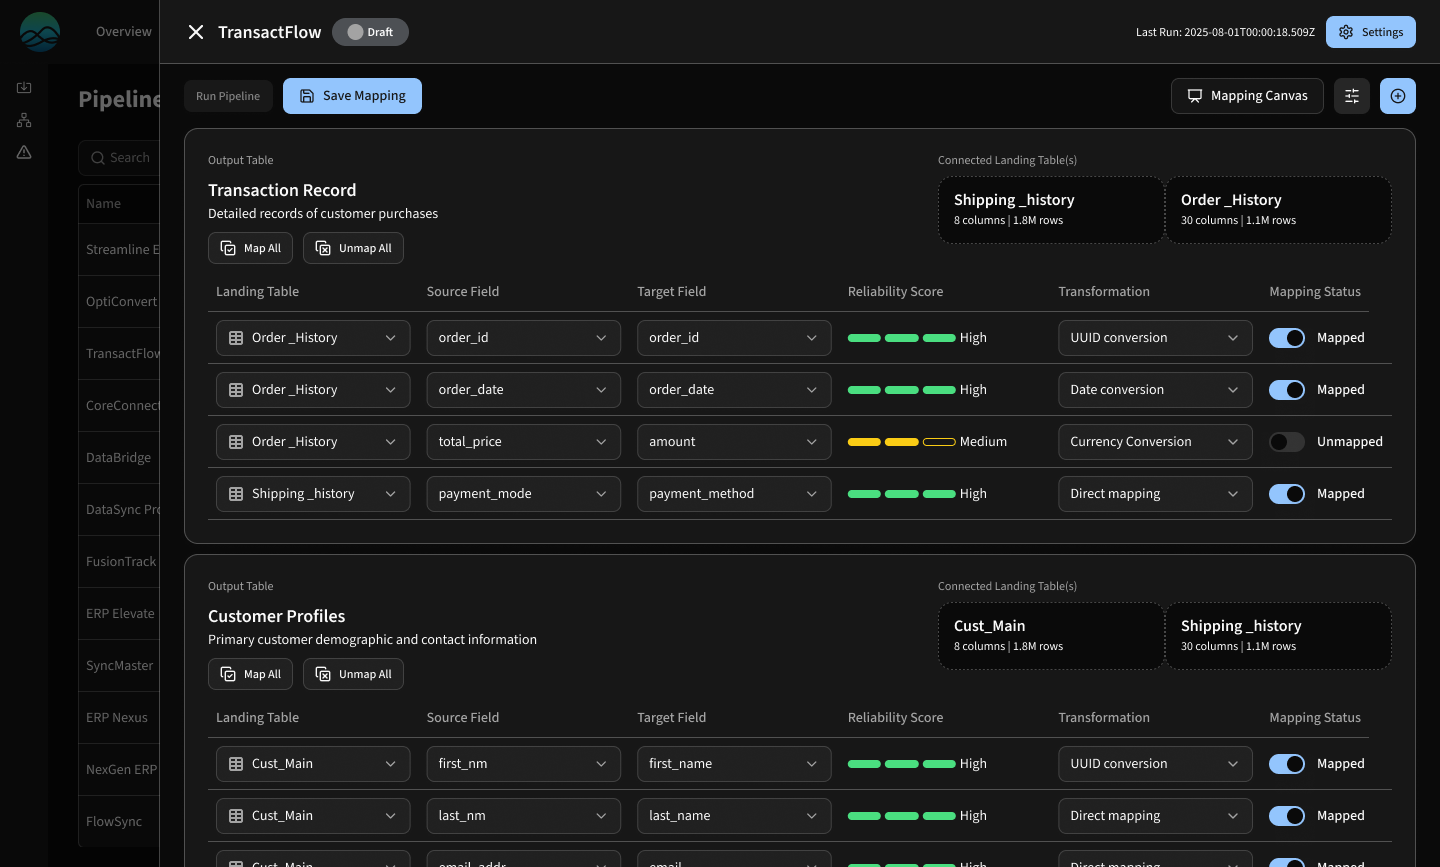
table-based concept aligned with legacy products; possible future option
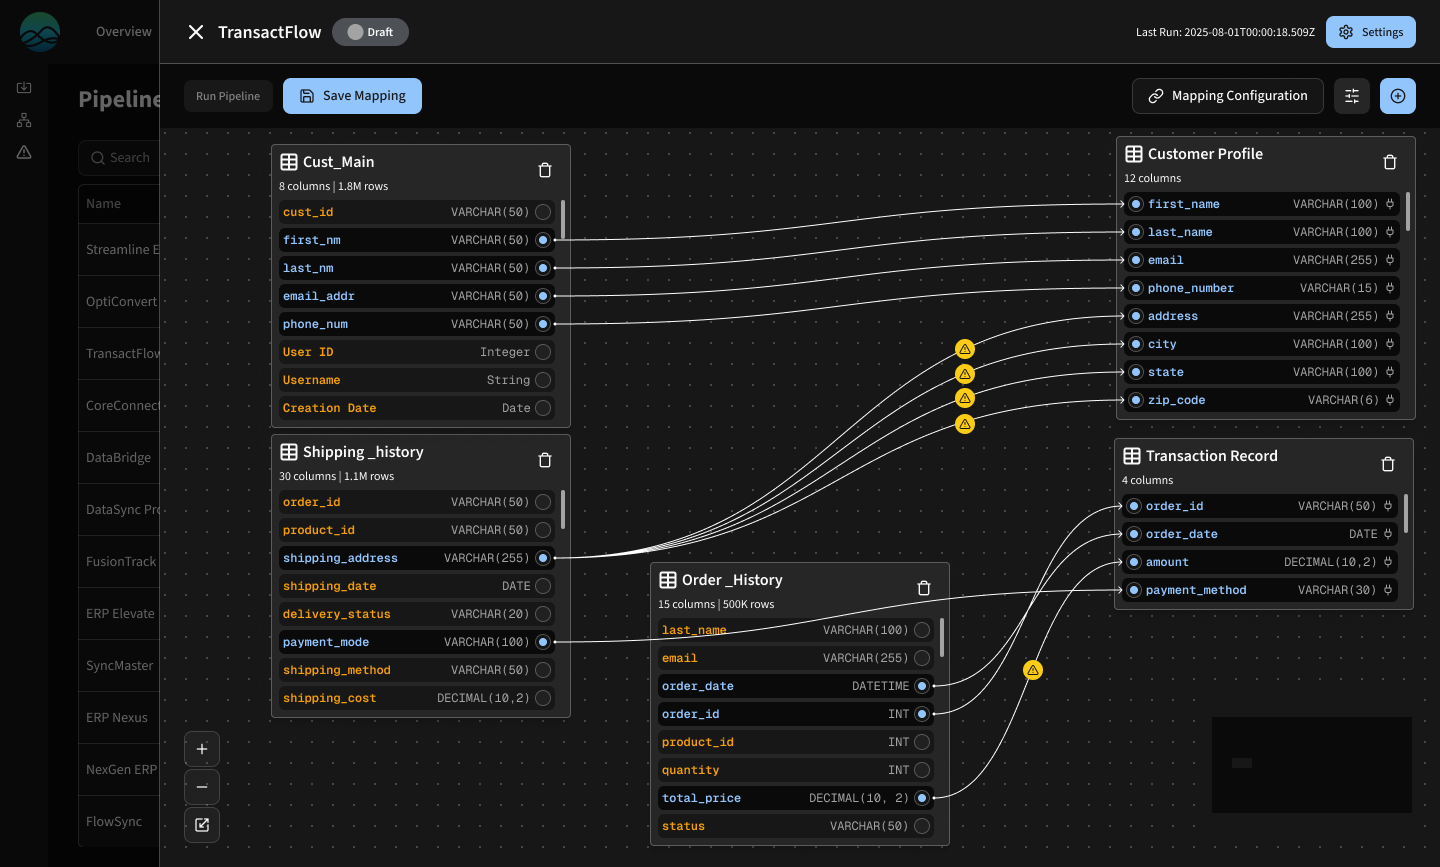
Visual canvas with drag-and-drop mapping lines that users liked early on.
Introducing ‘Schema mapper’
Because a phased rollout was required, we introduced a new canvas called ‘Schema Mapper’ where consultants review and manage mappings. ‘Pipeline builder’ is where consultant transforms data.
Is a unified canvas better? Yes.
Is this the right first step? Also yes.
Acting as a “workbook”, Schema Mapper enables:
Reviewing AI-suggested mappings
Confirming or editing them
Producing landing tables that become the starting point for transformations
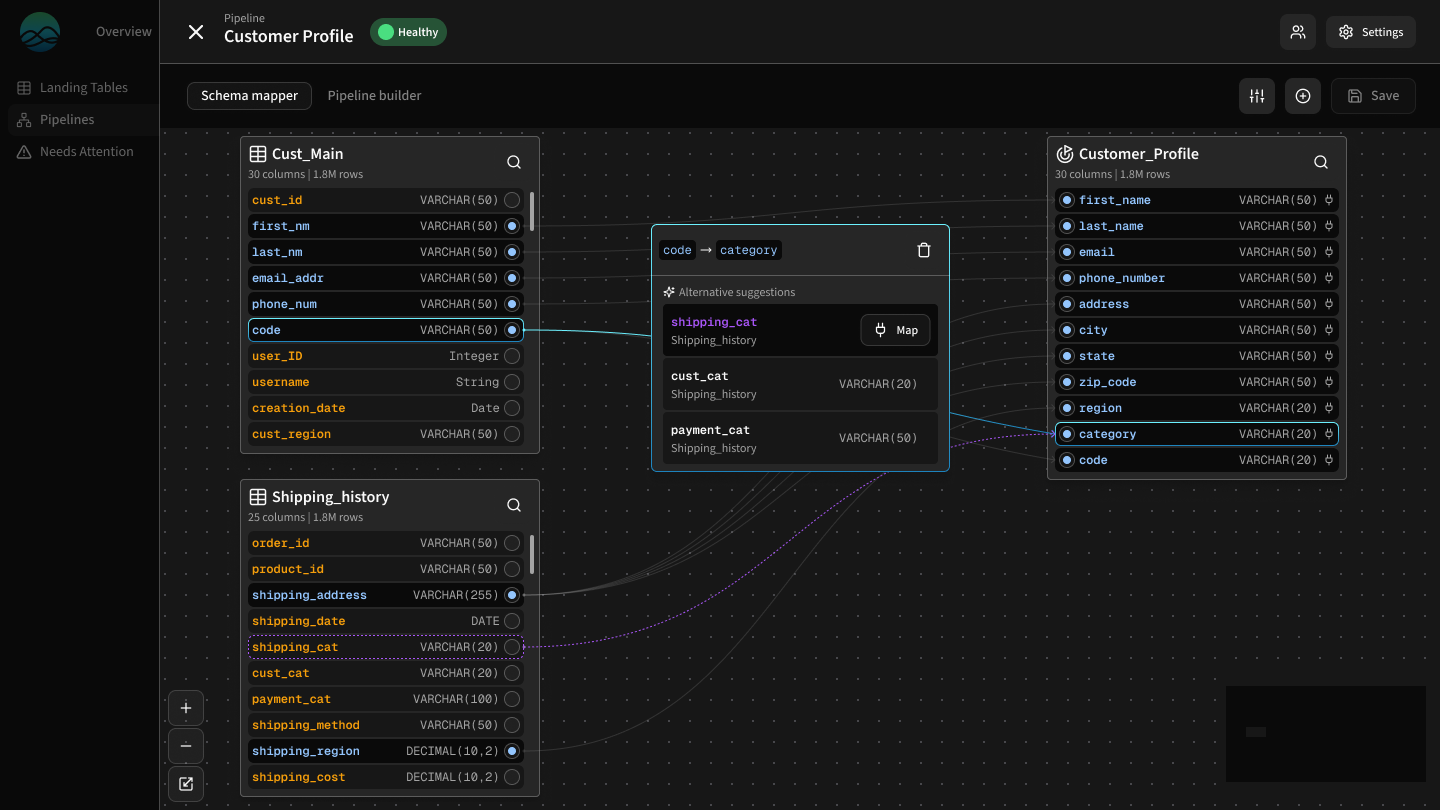
Experts can review and edit suggestions in the mapper/workbook.
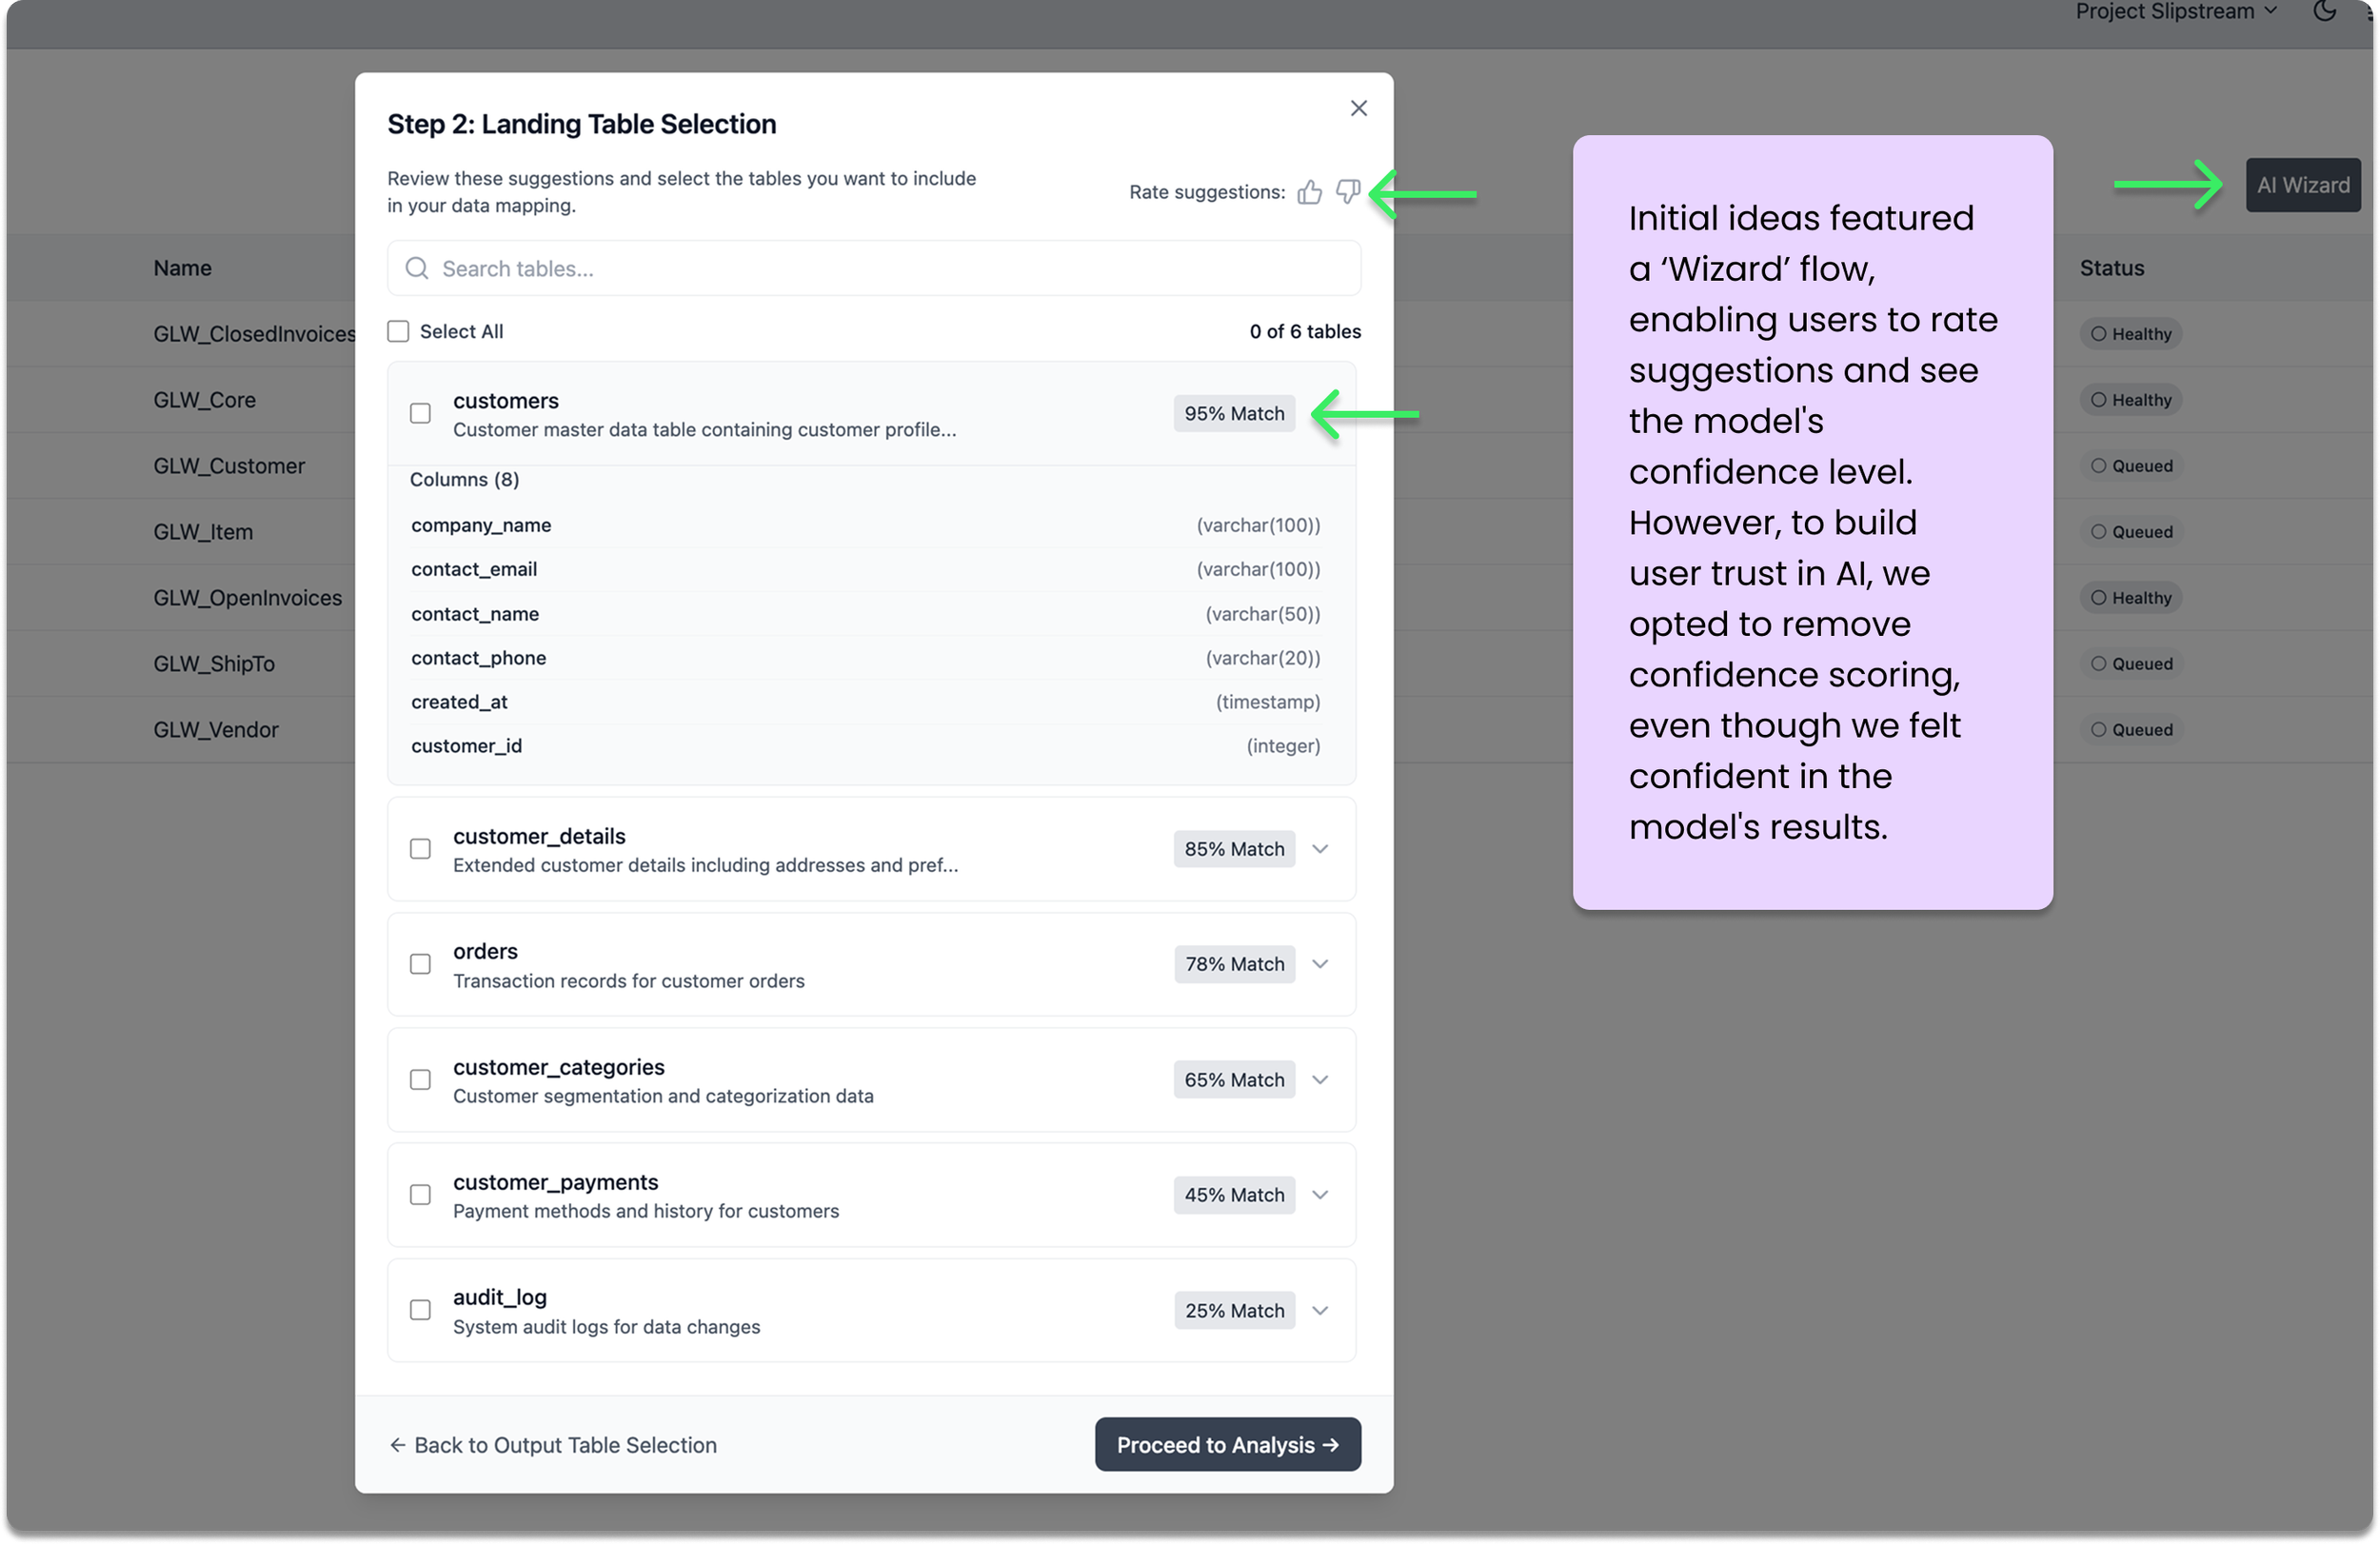
Model Limitations Shaped the UX
The early language model had real constraints:
It could only surface the highest confidence suggestion
It could not show alternative suggestions
Confidence scoring was requested by users but not feasible for the first release
Users said a confidence score would help them prioritize their review.
We scoped it out due to time and technical limitations.
Outcome (So Far)
The initial release provides:
A faster starting point for mapping
A place to validate AI suggestions
A foundation for future automation
A shared workflow between data experts, product, development, and data science
It shortens the early mapping phase significantly and prepares us for greater automation in future releases.